
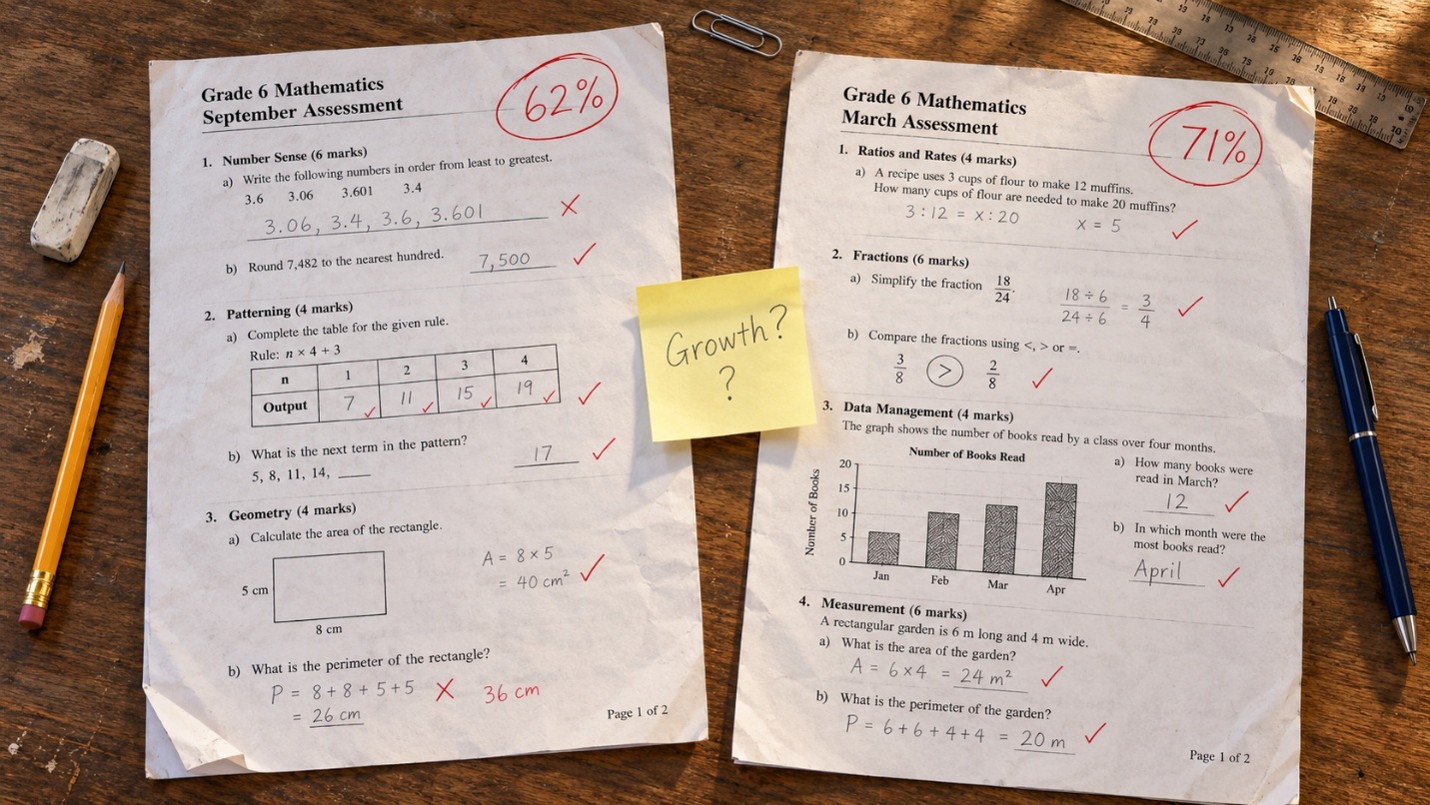
Here is a hypothetical case most assessment leads will recognise. A Grade 6 student scores 62% on the September mathematics assessment. In March, she scores 71%. The report shows a green arrow. Her teacher is pleased, her parents are pleased, and the nine-point rise goes into the school’s growth summary.
There is one more detail. The March paper covered different content and was written by a different team, and nobody checked whether it was easier or harder than the September paper.
So did she grow by nine points? She might have. She might have grown by more. She might not have grown at all. The percentage cannot tell you, because a percentage was never built to answer that question.
The short answer: a percentage score tells you how a student did on one particular set of questions. A scaled score places results from different tests on a common measurement scale. Because item difficulty has been calibrated onto that scale, a change in the score can be read as a change in the student rather than a change in the paper. If your question is “How did they do on this test?”, a percentage can answer it. If your question is “How far did they move?”, you need a common scale.
A Percentage Belongs to the Paper That Produced It
Seventy percent on an easy paper and seventy per cent on a hard paper are different achievements. Everyone knows this in principle, yet school reporting often ignores it in practice. Term results are placed side by side, averages are compared, and the difference is labelled “growth”.
A percentage only describes the share of these questions a student answered correctly. Change the questions and the meaning of the number changes with them. When two percentages come from two different papers, any difference between them mixes two things together: real change in the student, and change in the difficulty of the test. Nothing in the percentage can separate the two.
How a Scaled Score Changes the Question
A scaled score starts from a different idea. Each question is calibrated for difficulty, and student ability is estimated on the same scale as the questions. When tests are built from calibrated items, or linked through statistical equating, results from different papers can sit on one ruler.
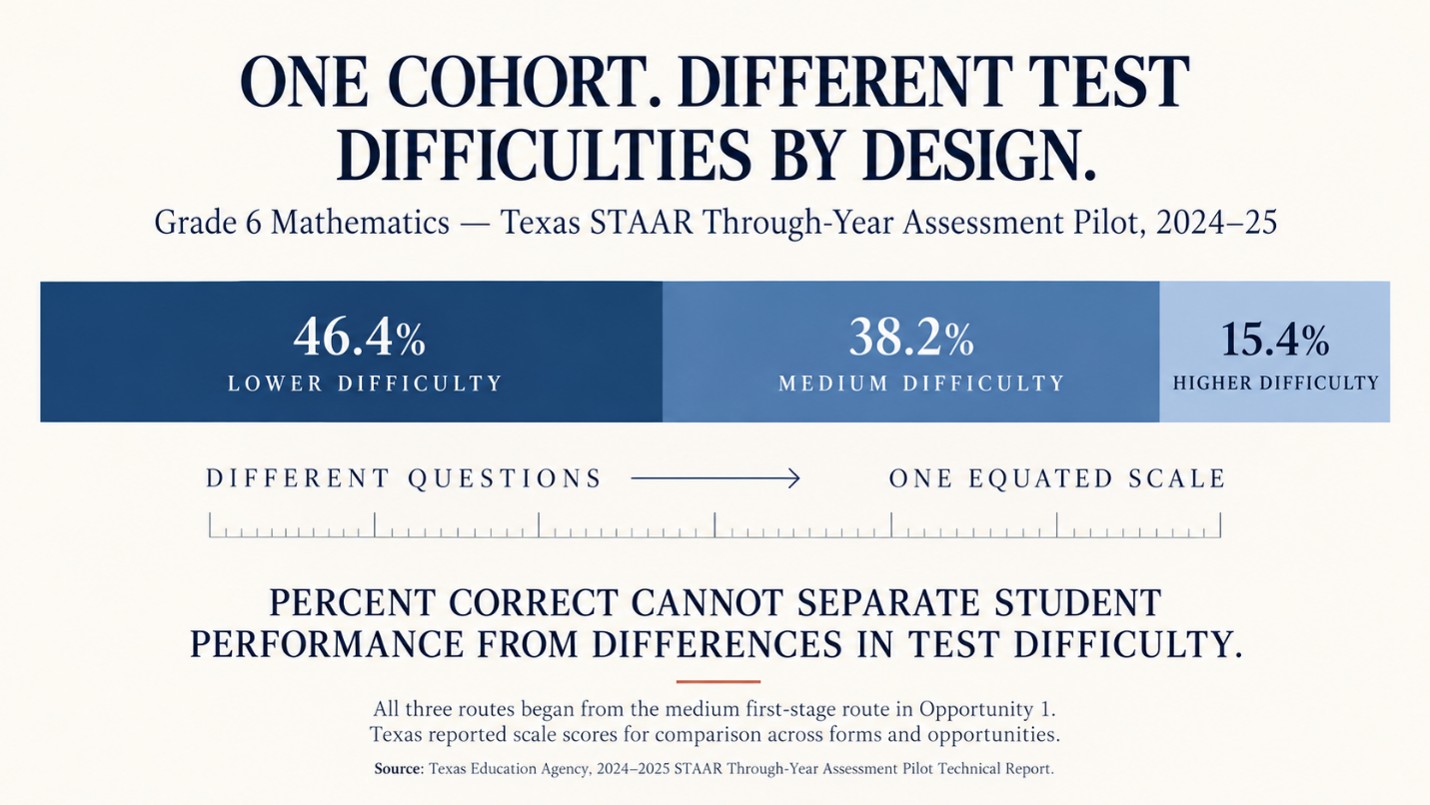
A recent public example shows why this matters. Texas ran a through-year assessment pilot in 2024–25, with three short tests in November, January and March. The tests used a multistage adaptive design, so students were routed to easier or harder forms based on their performance. In Grade 6 mathematics at the first opportunity, 46.4% of students were routed to the lower-difficulty second stage, 38.2% stayed on the medium form and 15.4% moved to the harder form.
Think about what that means for percentages. Students were answering different questions by design, so their percentage scores could never be compared fairly with one another, or across the year. The technical report explains that the tests were pre-equated using a Rasch model, and that the scale score is the measure intended for comparison across opportunities and test forms. Without a common scale, the adaptive design would have made growth impossible to read. This is also why the choice between adaptive testing and common papers is never only a question of test length. (texas)
The Same Gain Does Not Mean the Same Thing Everywhere
A common scale solves one problem and exposes another. Once growth is measured in points, leaders naturally want to know whether a given number of points is a lot or a little. The answer depends heavily on grade.
NWEA, a commercial assessment provider, published updated growth norms for its MAP Growth assessment in 2025. The norms draw on 116,225,831 test events from 13,804,182 students in 29,720 US public schools, tested between fall 2022 and spring 2024. On its vertical scale, average fall-to-spring growth in mathematics was about 15 points in Grade 3 but about 7 points in Grade 8. In reading, it was about 9 points in Grade 3 and about 2 points in Grade 8. The Texas pilot found the same broad pattern, with growth becoming smaller as grade level increased.
So a five-point gain might be weak for a Grade 3 class and typical for a Grade 8 class. NWEA’s growth norms are also conditioned on a student’s starting score and weeks of instruction, because where a student starts affects how much movement is typical. The manual is also clear that these norms describe what usually happens, not what should happen. They give context. They are not targets. (nweanwea)
That leads to a question worth sitting with:
If a Grade 8 reader gains two points and a Grade 3 reader gains nine, which of them has actually grown more?
Raw points alone cannot settle it. This is the same reason growth versus attainment needs careful handling in school reports.
Where Percentages Still Earn Their Place
None of this makes percentages useless. Within a single paper, percentage correct is often the most practical diagnostic tool a teacher has. Which competency did the class miss? Did students fall away only on the hardest items? A percentage answers those questions well, because they stay inside one test.
The Texas reports themselves use both. They show percentage of points earned by item difficulty level next to the scale score. One number supports the next teaching decision. The other tracks movement over time. texas
Trouble starts when a percentage is asked to do a job it was not designed for. This is common when setting mastery thresholds. “80% on the unit test” means 80% of that test, and it shifts every time the test changes.
Source: Texas Education Agency
Scaled Scores Are Not Automatically Trustworthy Either
A scale is only as good as the calibration behind it. If item difficulties were estimated on small samples, if the blueprint changes from term to term, or if testing conditions differ between campuses, the ruler bends.
Gain scores bring a risk of their own. The Texas pilot studied whether its gain score, a simple difference between the first and last test, could be inflated by low first-test scores, whether caused by low effort or deliberate under-performance. A low September result can make March look impressive. Growth evidence therefore needs the same integrity checks as attainment evidence. Across a school group, it also needs comparable results across schools: the same instrument, the same window and similar participation. texas
What Leaders Should Ask Before Reporting Growth
Before a growth figure reaches a board report, a few questions are worth asking:
- Are the beginning, middle and end-of-year assessments on one calibrated scale, or are we comparing percentages from different papers?
- How was item difficulty established, and on how many students?
- Did the blueprint stay stable enough for change to mean something?
- Are we reading gains against what is typical for that grade and starting point?
- Is the gain larger than the measurement error, or could it be noise?
Then ask the harder question:
If your growth report would show the same green arrow whether the March paper was easier or harder, what is it really measuring?
The Score Has to Match the Question
Percentages and scaled scores are not rivals. They answer different questions. A percentage describes performance on a paper. A scaled score describes a position on a scale that stays fixed while the papers change. Growth is a question about movement, and movement can only be measured against something that holds still.
Schools that keep these two jobs separate tend to report growth more honestly and to teach from their diagnostics more precisely.
Frequently Asked Questions
What is the difference between scaled scores and percentage scores?
A percentage score shows the share of questions a student answered correctly on one specific test. A scaled score converts performance onto a common scale that accounts for question difficulty, so results from different tests can be compared.
Can percentage scores measure student growth?
Only when students take the same test, or tests of proven equal difficulty, on both occasions. When the papers differ, a change in percentage mixes real learning with differences in difficulty.
What is a vertical scale score?
A vertical scale is a single scale that spans several grades, so a student’s results can be tracked across years. Large norming studies on vertical scales show that typical yearly growth gets smaller as students move into higher grades.
Is a bigger point gain always better?
No. Typical gains vary by grade and by starting score. A small gain can be normal in a higher grade, and a large gain can follow an unusually low first score. Gains should be read against typical growth and measurement error.
Should schools stop using percentages?
No. Percentages are useful for diagnosis within a single test, such as showing which skills or difficulty levels caused problems. They should not be used on their own to report growth across different tests.