

Here is a hypothetical example. Two campuses in the same group report Grade 7 reading results. Campus A averages 68%. Campus B averages 61%. At the leadership meeting, Campus A is praised.
Then someone opens the participation column. At Campus A, 71% of enrolled Grade 7 students completed the assessment. At Campus B, 97% did. Most of the missing students at Campus A were frequently absent, recently enrolled, or withdrawn for learning support.
Which campus did better? From these numbers, nobody can say.
An assessment result describes the students who took the test, not the whole cohort. Participation is part of the result, not a footnote to it.
Missing Students Are Rarely Missing at Random
Students who miss assessments are usually not a random slice of the class. They are more likely to be frequently absent, new to the school, receiving extra support, or dealing with problems at home. Online tests add another group: students whose device or connection failed.
Many of these students are also more likely to be lower-attaining. When they are missing, the average often rises, even though no student learned anything more. It can also work the other way, for example when strong students miss a test because of a competition or trip. Either way, the average no longer describes the cohort.
Even the World’s Largest Assessments Must Check
Source: OECD PISA 2022 Reader’s Guide
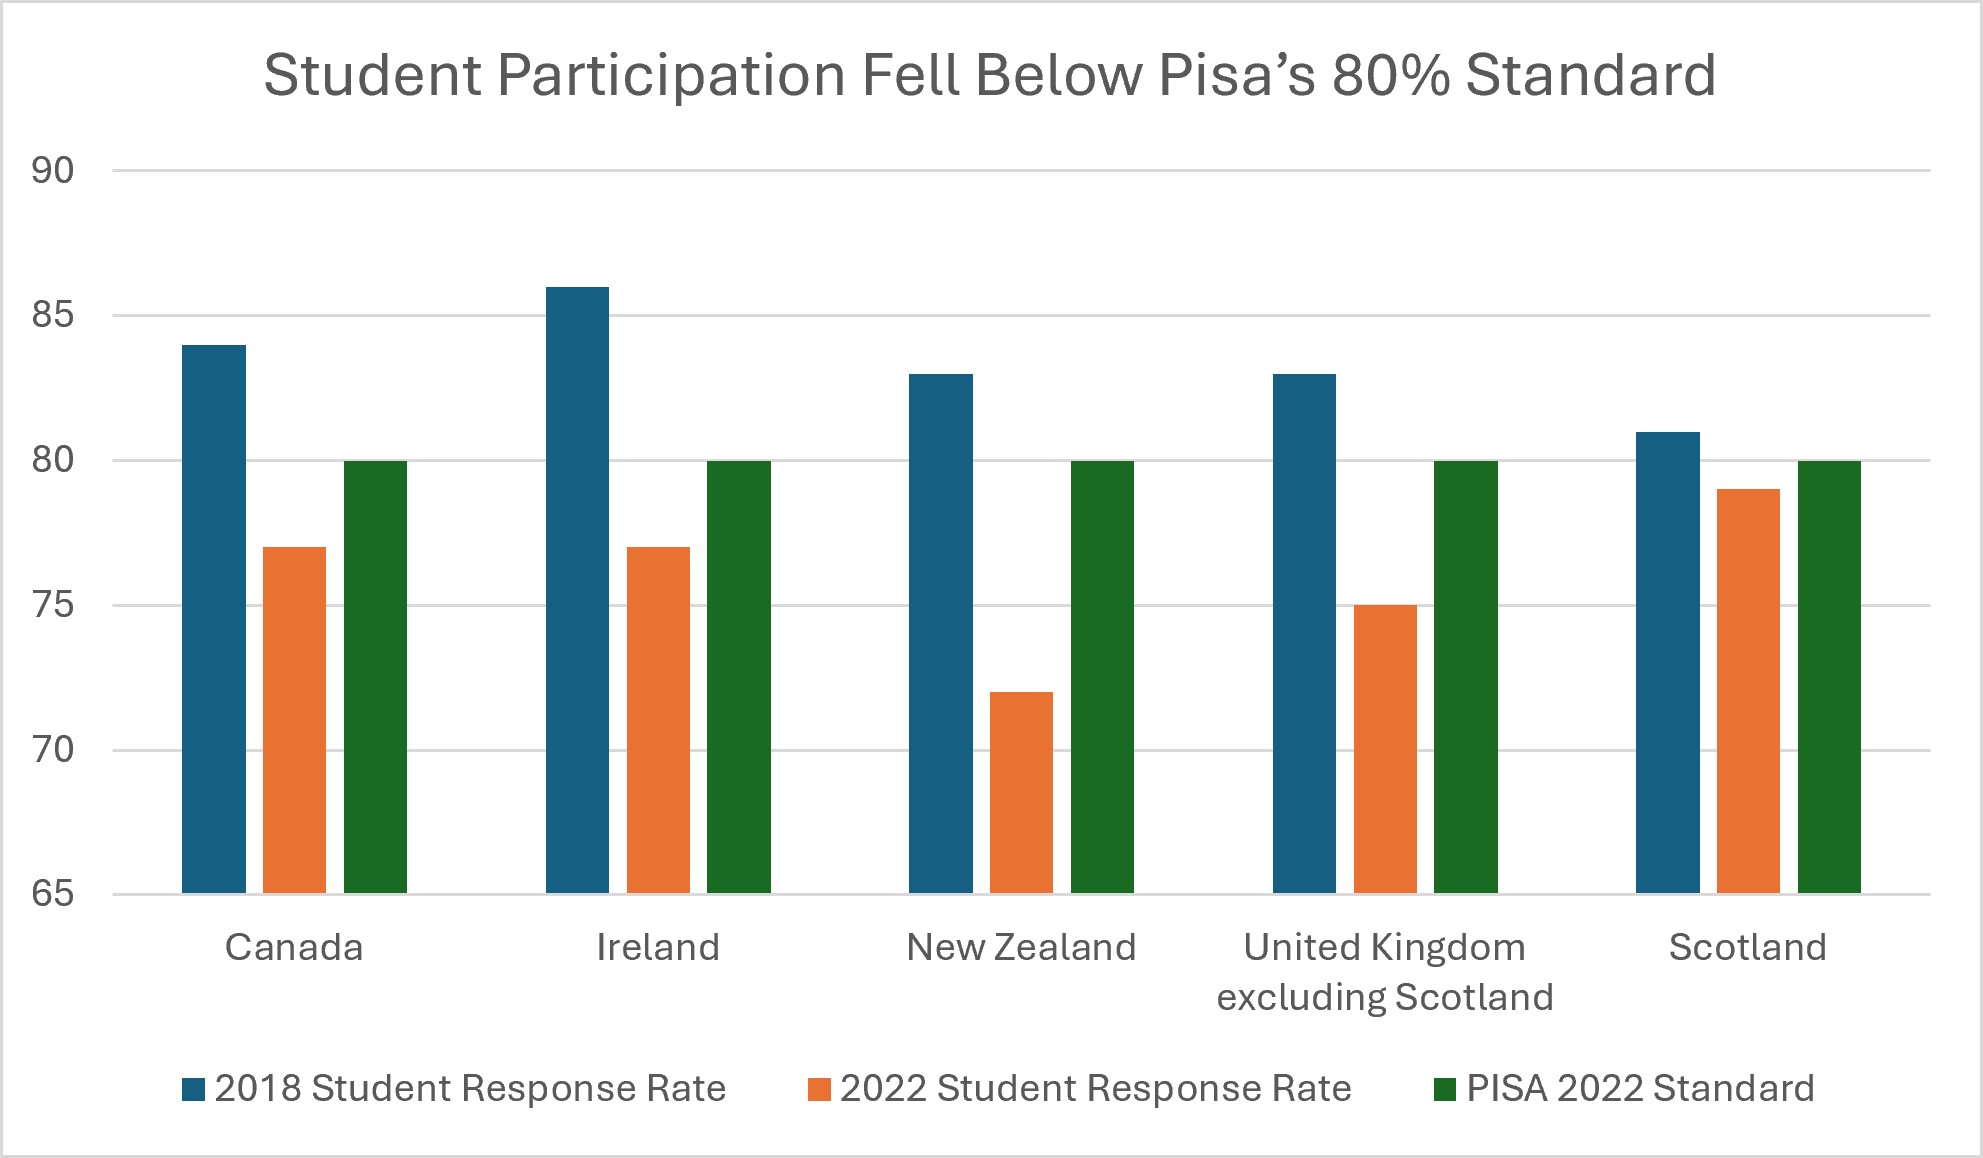
This is not only a school-level worry. Look at how the OECD handled participation in PISA 2022. For Canada, Ireland, New Zealand, the United Kingdom and Scotland, the OECD concluded that low response rates had most likely introduced more than minimal bias into the results. OECD
England’s own analysis made the direction clear. Even after statistical adjustments, it estimated a small remaining upward bias of about 0.07 standard deviations in reading and 0.09 in mathematics. This bias came entirely from students not taking part; schools not taking part did not produce a significant bias. OECD
For school leaders, the lesson is not the exact size of these numbers. National samples and school tests are very different, and these figures should not be applied to a single school. The lesson is that PISA has strict sampling rules and weighting procedures, and missing students still pushed results upwards. A school or network with no adjustments and a much lower sitting rate has even more reason to check.
What to Check Before Anyone Reads the Average
Start with the participation rate for every group being compared. Before looking at any average, leaders should know what percentage of enrolled students actually completed the assessment, broken down by campus, grade and class. If one campus tested 97% of its students and another tested 71%, the two averages are not describing the same thing, and comparing them is unfair to both.
Next, look at who is missing, not just how many. Check whether the absent students differ from those who sat the test in prior attainment, attendance or support needs. This tells leaders the likely direction of the bias. If the missing students were mostly lower-attaining, the average is probably flattering the school. If they were mostly high attainers away at a competition, it may be doing the opposite.
It is also worth separating students who started the assessment from those who finished it. A student who logs in, answers five questions and leaves can pull an average down or be quietly excluded from it, depending on how the system handles partial attempts. Either way, the result no longer shows what that student knows.
Exclusions deserve the same attention. Leaders should ask who was deliberately not entered for the assessment and why, and make sure every exclusion is recorded with a reason. Entry decisions can shape results as much as teaching does, even when nobody intends it.
Timing and conditions matter too. If some students sat the test late in a catch-up session, check whether they had the same time, support and setting as everyone else. Different conditions weaken comparability, even when the paper is identical.
Finally, compare participation between cycles. If participation in September was very different from participation in June, an apparent growth trend may be an artefact of who was counted rather than a real change in learning. A school can appear to improve simply because fewer struggling students sat the second test.
Participation belongs at the heart of making assessment results comparable across schools, and any network approach to benchmarking academic standards across a school group should report it next to every average.
If a school’s average rises because fewer struggling students sat the test, has anything improved for a single child?
Growth Measures Are Affected Too
Participation problems do not stop at single results. If the students who sat in September are not the same students who sat in June, “growth” compares two different groups. Growth should be calculated on matched students who sat both assessments, and the number of unmatched students should be reported. This is one reason student growth versus attainment matters: both attainment and growth can be shaped by who was counted.
Set the Participation Rule Before the Results Arrive
Leaders can reduce this problem with a few decisions made in advance.
Agree a participation threshold below which results are reported with a clear warning, or not compared at all. Always show the participation rate beside the average, never on a separate page. Schedule catch-up sittings so that absence on one day does not become absence from the data. Record the reason for every exclusion.
Most importantly, remove the quiet incentive. If campuses are ranked only on averages, the system rewards low entry, even if no one intends that. Adding participation to school improvement KPIs keeps attention on every student.
Would you trust a parent survey that heard from only two-thirds of families, and mostly the ones who were already happy?
Count Before You Compare
Before a result can be compared, praised or acted on, leaders need to know whose learning it describes. Checking participation takes a few minutes. Skipping it can lead to a year of decisions based on the students who happened to be in the room.
FAQs
Q: What is participation bias in school assessment?
A: It is the distortion that occurs when the students who complete an assessment differ from the students who do not, so the results no longer represent the whole cohort.
Q: What participation rate is good enough?
A: There is no single rule for schools. For reference, PISA 2022 set a standard of 85% weighted school participation, and several countries missed it. Each school group should agree its own threshold in advance and apply it consistently. OECD
Q: Should absent students be given a score of zero?
A: No. A zero records absence as if it were a lack of knowledge. Report absent students separately and arrange catch-up sittings where possible.
Q: Does participation affect growth measures?
A: Yes. Growth should be calculated only for students who sat both assessments, and the number of unmatched students should be reported alongside it.