
A maths department meets after the Term 1 assessment. The dashboard is clear, the charts are tidy, and the team agrees to “focus on fractions”. Three weeks later, the fractions lessons look almost exactly as they did before.
Nobody ignored the data. The meeting simply stopped one step too early. “Focus on fractions” is a topic, not a decision. It does not say which students, which misunderstanding, what will change in the lesson, or how anyone will know it worked.
Assessment data drives instruction only when it reaches a specific teaching decision that someone makes and later checks. Everything before that point is information. The work that matters happens after it.
The Research: Positive on Average, Very Different in Practice
The most recent large synthesis supports this view. Spiele, Janssen, Schildkamp and Poortman reviewed professional development programmes that train teachers to use data. Across 27 studies with 86 effect sizes, they found an average positive effect on student achievement of g = 0.41, with a 95% confidence interval of 0.20 to 0.63. However, the prediction interval ran from −0.71 to 1.54. In other words, a future programme could plausibly have a negative effect or a very large positive one. The effect of teacher data use professional development interventions on student achievement: A meta-analysis and qualitative comparative analysis – ScienceDirect
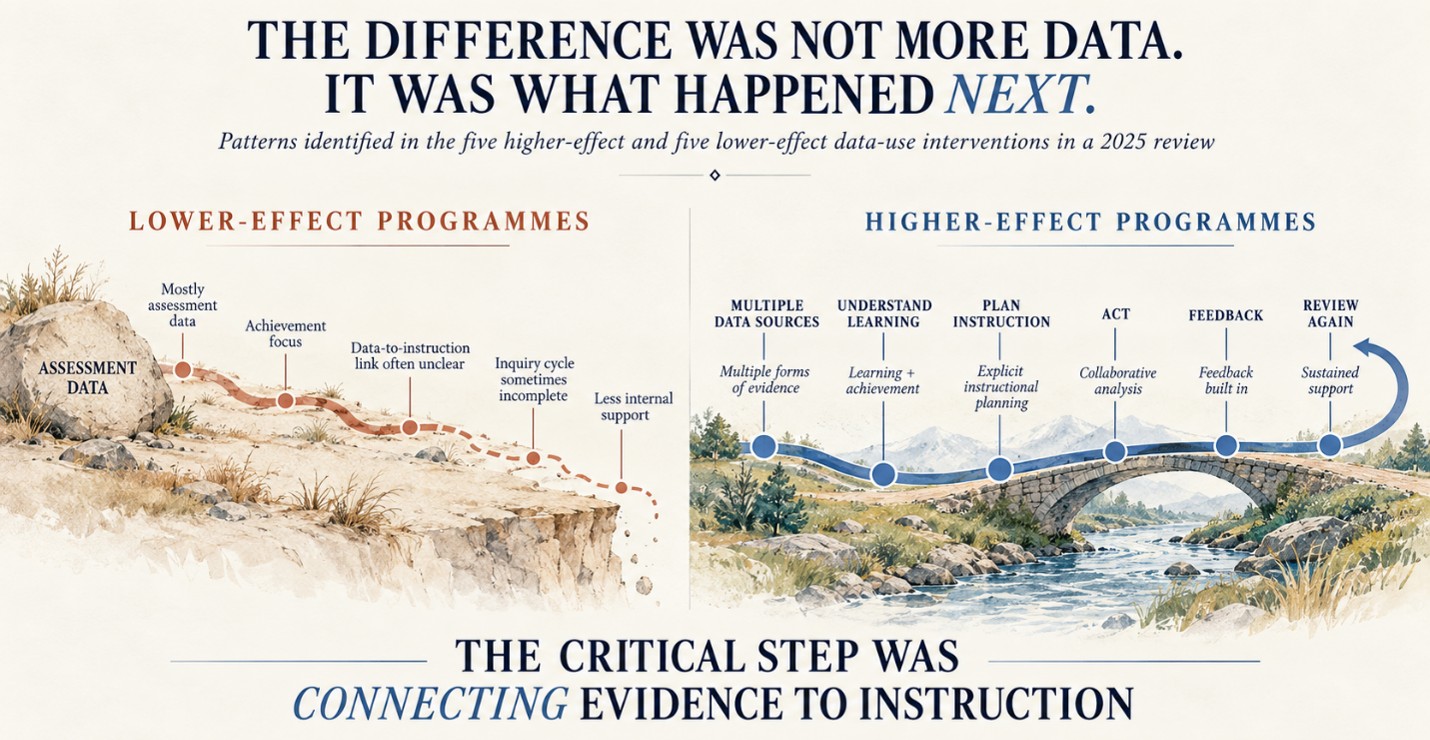
The more useful finding is about why results differed so much. The authors compared the five programmes with the highest effects to the five with the lowest. In the low-effect programmes, the link between the data and classroom instruction was often not made explicit, and the authors concluded that teachers may not have known how to change their teaching based on the data. In two of them, interim assessment data was used mainly to predict state test results rather than to diagnose learning. The high-effect programmes followed an inquiry cycle, used several types of data, focused on learning as well as achievement, linked data explicitly to instruction, and included long-term support.
This qualitative comparison shows association, not proof. Even so, its message fits what many schools already experience: the problem is rarely too little data. The problem is the missing step between the result and the lesson.
Four Questions That Turn a Result Into a Decision
1. What exactly did students get wrong? Go below the topic to the skill. “Fractions” is too broad. “Cannot place fractions on a number line” is something a teacher can act on. Building this habit is the core of assessment data literacy for teachers.
2. Why did they get it wrong? The same low score can come from missing knowledge, knowledge students cannot yet apply, a shared misconception, or a question that was pitched too hard.
3. What will we do differently, for whom, and by when? This is the decision itself. It often comes down to deciding whether to reteach, practise or move on.
4. How will we know it worked? Plan a short check before the teaching starts. Without a check, the decision can never be judged, and the next data meeting starts from zero.
| Assessment finding | Weak response | Decision-ready response |
| Class average 54% on fractions | “Focus on fractions” | 14 students cannot place fractions on a number line. Reteach with number-line models over three lessons, then recheck with five items on Friday |
| Low scores on problem-solving | “Do more practice papers” | Students solve routine items but fail multi-step ones. Add two worked-example lessons, then reassess in the unit test |
| Most students chose the same wrong option on Q7 | “Reteach the whole topic” | Address that one misconception directly in a single targeted lesson |
| Grade 8 lower than last year | “Teachers need to push harder” | First check participation and paper difficulty, then compare skill-level results with last year |
Leaders Make Different Decisions From the Same Data
Teachers decide what happens in the next lesson. Leaders decide timetables, intervention staffing, professional development focus and curriculum sequence. Leaders need the same discipline, applied to aggregated data: a finding, a likely cause, an action with an owner, and a check. Learning analytics for school leaders explores which measures deserve leadership attention.
If an assessment identifies a gap but changes nothing about tomorrow’s teaching, what was the assessment actually for?
Make Every Decision Visible and Checkable
A simple habit helps: end every data meeting with a written decision record. It should state the finding, the suspected cause, the action, the owner, the date and the planned check. Treat each decision as a hypothesis to test, not a conclusion to defend.
The high-effect programmes in the 2025 review shared collaboration and sustained support. A school cannot copy a research programme, but it can copy the structure: teams that meet regularly, look at their own students’ work, decide something specific, and come back to check. The full loop is described in the assessment-to-intervention cycle.
How many of last term’s data meetings ended with a decision that someone could later check?
Data Becomes Useful at the Point of Decision
Schools do not need more dashboards. They need a shorter distance between a result and a change in teaching, and the honesty to check whether that change worked. When that loop runs, assessment stops being an event and becomes part of how teaching improves.
FAQs
Q: What is data-based decision making in schools?
A: It is the practice of analysing assessment and other school data, making a specific teaching or organisational decision from it, and then checking whether that decision improved learning.
Q: Does using assessment data improve student achievement?
A: A 2025 meta-analysis found a positive average effect from teacher data-use training, but results varied widely between programmes. How the data is used matters more than whether it is collected. ScienceDirect
Q: Why do data meetings often fail to change teaching?
A: They often end at the topic level (“focus on fractions”) without naming the students, the misunderstanding, the change in teaching and the check that will follow.
Q: What is the difference between data and evidence?
A: Data is the raw result. It becomes evidence when it is interpreted for a specific question, such as why students struggled with a particular skill.