

Picture two campuses in the same school group. Campus A reports an 86% average in end-of-year mathematics. Campus B reports 71%. At the results review, Campus A gets the praise and Campus B gets the action plan.
Now add one detail. In September, Campus A’s students were already averaging 84%. Campus B’s were averaging 58%.
Campus A barely moved its students. Campus B moved its students a long way. One caution: raw percentages from different tests cannot simply be subtracted. This is why leaders need to understand when percentages cannot answer a growth question. Even so, the direction of the story is hard to ignore.
This is the core of the student growth vs attainment debate. Attainment tells you where students are. Growth tells you whether the school is moving them. A high-scoring school may still need attention because a high average can come mostly from who walked through the door, not from what happened after they arrived.
Attainment Describes the Intake as Much as the Teaching
Attainment is the level a student reaches at one point in time: a final exam mark, a proficiency band, a term grade. It answers an important question: are students where they need to be?
Growth is the change in the same students over time, ideally measured on the same scale. It answers a different question: did learning move during the time these students were with us?
The difficulty is that attainment carries a lot of history. A student’s score in May reflects years of earlier schooling, home support, tutoring, language background and prior knowledge. A school with a selective or advantaged intake can post strong averages while adding relatively little. A school serving students who arrive far behind can be doing excellent work while its averages still look modest.
None of this makes attainment useless. It just means a single attainment figure cannot tell you how effective a school is.
What Research Says About Levels and Progress
A study by Joshua Angrist, Peter Hull, Parag Pathak and Christopher Walters, tested this question with unusual rigor. The researchers studied middle-school applicants in New York City and Denver, where centralized school assignment includes a random element. That randomness allowed them to estimate each school’s actual contribution to learning, then check how well common school ratings predicted it. mit
They compared two kinds of rating. A “levels” rating was based on the share of students scoring proficient in maths and English. A “progress” rating was based on year-to-year improvement in students’ achievement percentiles, similar to the student growth percentiles many US states report.
The gap between the two was large. In New York, the levels rating explained only about 5% of the variation in schools’ estimated causal impact, while the progress rating explained about 57%. In Denver, the figures were about 22% and 74%. The authors also found that ratings based on proficiency levels were strongly linked to schools’ demographic make-up, and they attributed this mainly to selection bias rather than to differences in school quality.
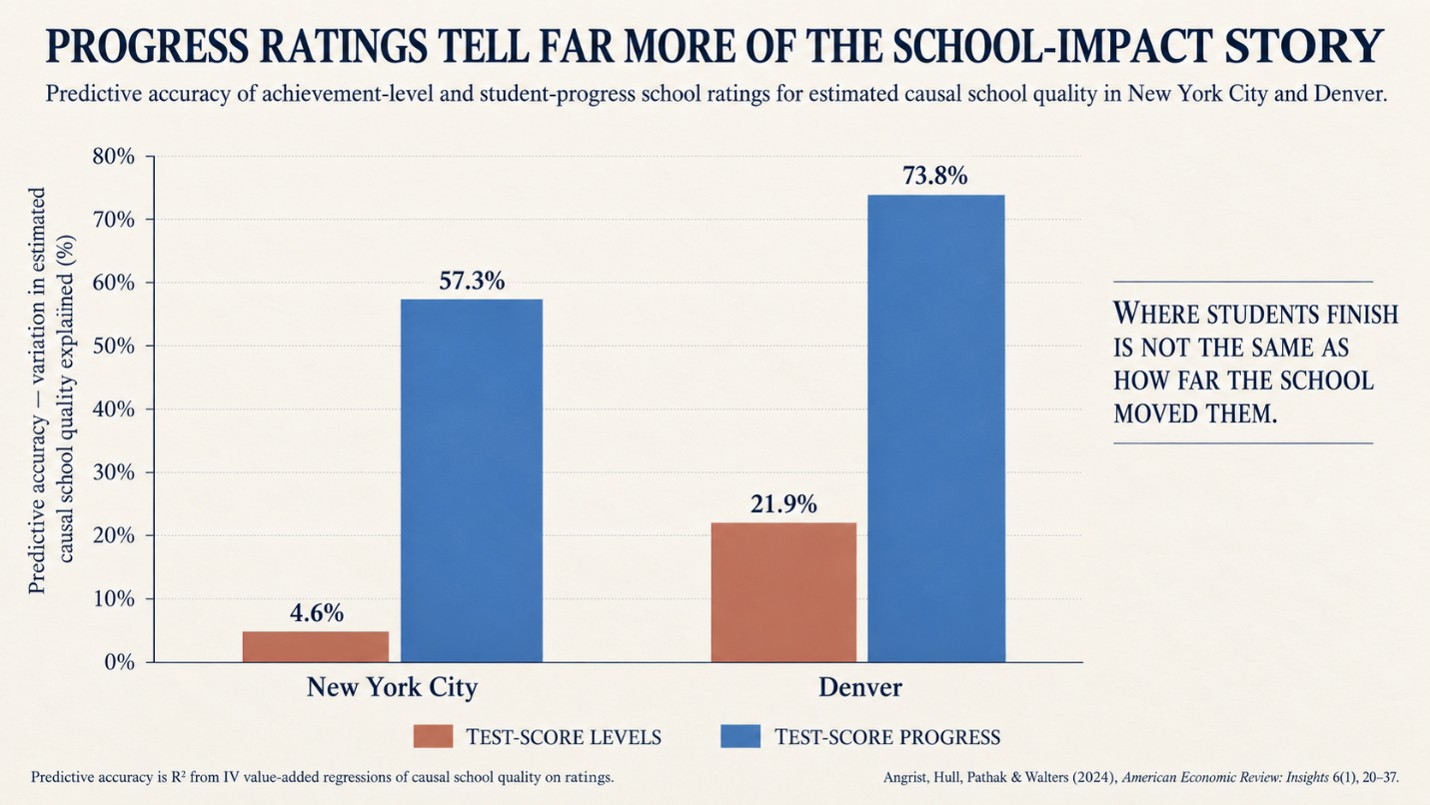
The limits of this study matter. It covers sixth-grade state test results in two large US urban districts, with roughly 1,584 school-year observations in New York (2016–17 to 2018–19) and 435 in Denver (2012–13 to 2018–19). The progress ratings were not perfect either, because they still showed some selection bias. The findings do not automatically transfer to an Indian, Gulf or UK school group.
The direction of the evidence is still useful for leaders anywhere. If you judge schools only by how high their students score, you are largely measuring intake. If you look at how far students move, you get much closer to what the school itself contributes.
Where a High Average Can Hide a Real Problem
When leaders look past the headline score, three patterns tend to appear in high-attaining schools.
The first is the coasting high attainer. A student who scores 88% in September and 89% in June passes every assessment. They are never flagged, never discussed, and appear on no intervention list. Over a full year, though, they have barely grown. Low score with low growth is a group every school already watches. High score with flat growth usually goes unnoticed.
The second is the stalled group inside a strong average. A school average of 82% can include a cohort of lower attainers who have not moved at all. The strong performers lift the mean and hide them.
The third is a participation problem. If weaker students were absent, exempted or did not complete the test, the average rises without anyone learning more. Before trusting any high result, it is worth checking who actually took the assessment.
Here is a question worth asking at your next results review:
If your highest-scoring campus had an ordinary teaching team, would its average look very different?
If the honest answer is “probably not,” the score tells you more about the intake than about the school.
Growth Changes the Question Leaders Are Asking
Attainment-only reporting asks “who scored highest?” School growth measures ask “where is learning moving, and where has it stopped?” That second question is far more useful for decisions.
In practice, this means leaders need a few things in place:
- The same students measured at least twice, for example at the beginning and end of the year, on a scale that allows fair comparison.
- Growth broken down by starting point, so you can see whether high attainers are being stretched and whether low attainers are catching up.
- Participation shown next to performance, so that a rising average caused by fewer test-takers is not mistaken for improvement.
- Attainment and growth read together across campuses. A league table built on one number creates the wrong incentives. Benchmarking across a multi-school group works better when it shows both dimensions.
Growth data also needs some humility. Small cohorts produce noisy numbers, and one year of flat growth can have many causes. Treat growth as a reason to ask questions, not as a final judgement.
Attainment Still Matters, Just Not on Its Own
It would be a mistake to swap one number for another. A school that moves students from very low to low has shown real growth, but those students may still lack the knowledge they need for the next stage. Attainment keeps that standard visible.

The stronger approach is to read the two together. High attainment with high growth is a school doing well. Low attainment with high growth is a school doing important work that may be under-recognised. Low attainment with low growth needs support. High attainment with low growth is the quadrant this article is about, and it is the one most likely to escape attention.
That raises a second question for school-group leaders:
What would change in your improvement priorities if you looked at growth before you looked at rank?
For many groups, the honest answer is that the “best” school would start receiving some of the scrutiny it has been spared. Leaders who want to act on this can start with choosing a school improvement priority from assessment evidence.
Reading the Score and the Story Behind It
A high score is good news, but it is incomplete news. It tells you where students ended up, not how far the school carried them. Recent evidence suggests growth-based measures give a much clearer picture of school effectiveness than attainment alone, even though neither measure is perfect.
The schools that improve fastest are rarely the ones that ignore their top results. They are the ones that ask, every cycle, whether every group of students actually moved.
Frequently Asked Questions
What is the difference between student growth and attainment?
Attainment is the level a student reaches at one point in time, such as a final exam score. Growth is how much the same student’s learning changed between two points, such as the start and end of the year. Attainment shows position; growth shows movement.
Can a high-scoring school still be underperforming?
Yes. If students arrived with high prior attainment and made little progress during the year, the school can post strong averages while adding relatively little learning. High attainment combined with flat growth is a common and often overlooked pattern.
Why are growth measures seen as a fairer way to judge schools?
Growth measures account for where students started, so they are less influenced by intake and background. A 2024 study of New York City and Denver middle schools found that progress-based ratings predicted schools’ real impact far better than proficiency-based ratings.
How often should schools measure student growth?
At minimum, schools need two comparable points in a year, usually beginning and end of year. Many schools add a mid-year check so they can adjust teaching before the year ends. The key requirement is measuring the same students on a comparable scale.
Should school leaders stop reporting attainment?
No. Attainment shows whether students are reaching the standard they need for the next stage. The goal is to read attainment and growth together, so strong averages do not hide stalled learners and strong progress is not mistaken for full readiness.