

Every US district budget has a line for professional development. Almost none has a line called “teachers we lost this year.” That second cost is still real. It is just spread across HR time, substitute pay, job fairs, background checks and new-hire orientation, so nobody sees it as one number.
There is an awkward fact inside that hidden cost. When a teacher leaves, the district still pays for teacher development. It pays to train the replacement instead of growing the person who walked out the door.
That is the business case in one sentence. Investing in teacher growth is not an extra cost added on top of running a school. Much of it is money a district will spend either way. The real choice is whether it goes toward keeping experienced teachers or toward restarting with new ones every year.
What a Departing Teacher Actually Costs a US District
The best current US estimate comes from the Learning Policy Institute’s 2024 turnover cost calculator. It sets the per-teacher cost of turnover at $11,860 for small districts (under 10,000 students), $16,450 for medium districts (10,000 to 50,000 students) and $24,930 for large districts (more than 50,000 students).
| District size (students) | Estimated cost to replace one teacher (2024 dollars) |
| Small (under 10,000) | $11,860 |
| Medium (10,000–50,000) | $16,450 |
| Large (over 50,000) | $24,930 |
Source: Learning Policy Institute, 2024 Update: What’s the Cost of Teacher Turnover?
Look at what the bill includes, though. LPI’s cost categories include mentoring and structured induction, mentor stipends, orientation events, onboarding workshops and professional development for new hires. In other words, teacher development is already in the turnover bill. It is simply being spent on starting over.
A hypothetical example makes the scale clear. A medium-sized district that loses 40 teachers in a year would spend roughly $658,000 on replacement alone at LPI’s average rate. That figure is for illustration only, but it is the kind of number most school boards never see in one place.
Most Teachers Who Leave Are Choosing to Leave
If turnover were mostly retirement, there would be little a district could do. National data say otherwise.
A March 2026 Learning Policy Institute study using National Center for Education Statistics surveys found that 15.1% of US public school teachers moved schools or left the profession between 2020–21 and 2021–22. Of these, 8.0% moved schools and 7.1% left teaching. More important for leaders, nearly three in four of those teachers (74%) left voluntarily for reasons other than retirement.
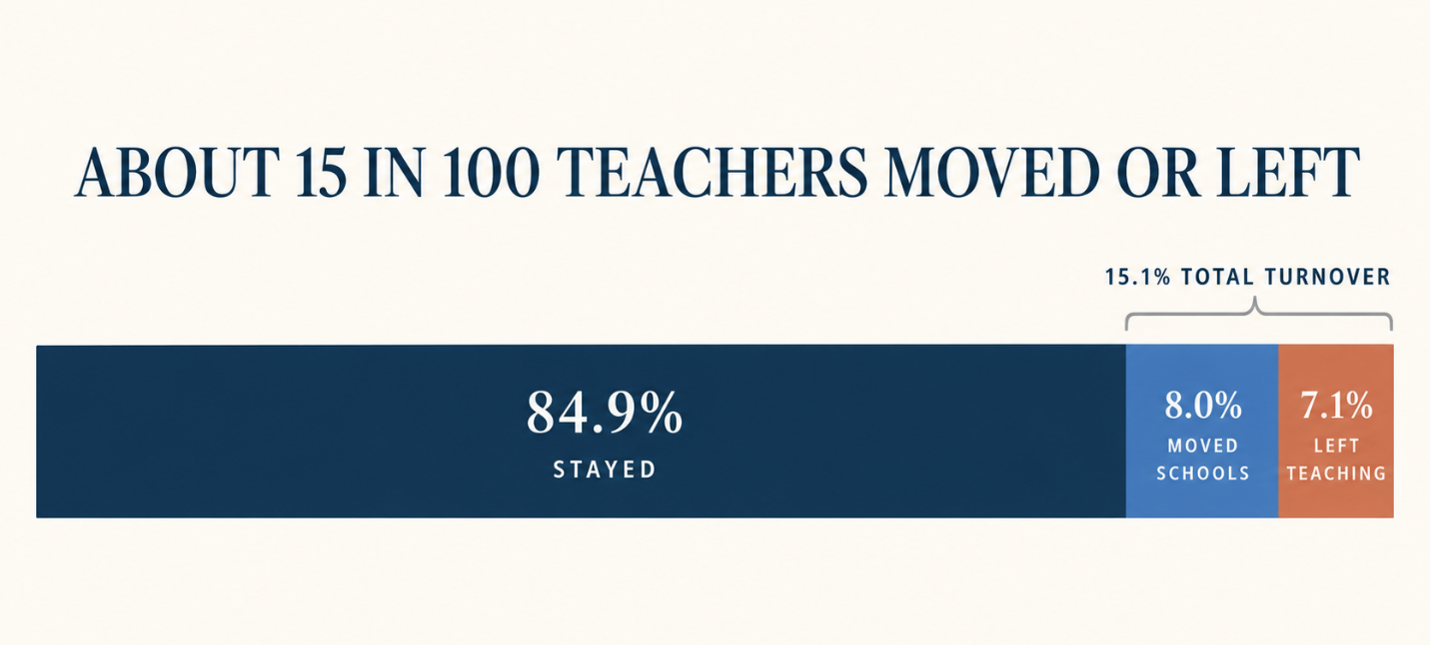
That does not mean every departure is preventable. Some teachers move for family, housing or pay that no school can match. But it does mean a large share of turnover is a decision, and decisions respond to conditions.
What National Data Connects to Teachers Staying
The same LPI study examined which conditions were linked to lower turnover after controlling for teacher and school characteristics. Three findings matter here.
Leadership that supports growth. Turnover fell from 18.7% to 9.0% when comparing teachers who reported low versus high leadership effectiveness and support. The researchers describe effective leaders as supportive, clear about vision, and good at encouraging collaboration and promoting professional development.
Satisfaction with the job itself. Teachers with high job and workplace satisfaction left at 8.0%, compared with 22.0% for teachers with low satisfaction. Lower satisfaction was linked to more paperwork and administrative duties, longer hours, larger classes and test-related job insecurity.
Pay still matters. For every $1,000 increase in cost-of-living-adjusted salary, the probability of turnover fell by about 0.34 percentage points on average. Any honest business case should say this plainly. Growth investment does not replace fair pay.
For school leaders, one reasonable implication is this: the conditions linked to retention look less like a training calendar and more like a working culture. Professional development appears inside the leadership finding, alongside collaboration and a clear vision. It is part of how teachers experience being supported, not a standalone event.
Annual Training Days Are Not the Same as Teacher Growth
Here is where many districts spend money without getting the retention benefit. A one-day workshop counts as “PD” on paper. Whether a teacher feels they are growing is a different question.
| Spending that looks like growth | Investment that builds growth |
| Whole-staff training days with no follow-up | Ongoing coaching connected to a teacher’s own classroom |
| Generic induction for every new hire | Mentoring matched to subject and school context |
| One promotion route: leave the classroom | Career pathways that reward expertise and mentoring |
| Collaboration time filled with admin | Protected time for peer observation and lesson study |
| Student data shared mainly for accountability | Student evidence shared to help teachers improve practice |
The right-hand column matches what the LPI study recommends. The authors call for ongoing professional learning, protected time for collaboration such as peer observation and lesson study, and pay or roles that recognize expertise, mentoring and career advancement. They also point to high-quality mentoring and induction to reduce early-career turnover.
Building these structures over a teacher’s whole career is the subject of professional development pathways for teachers. For new teachers specifically, see induction and coaching for new teachers.
So a useful question for any district finance team is this:
If you already pay to train every replacement teacher, is the real decision whether to invest in teacher growth, or only which teachers receive that investment?
What to Put in the Business Case
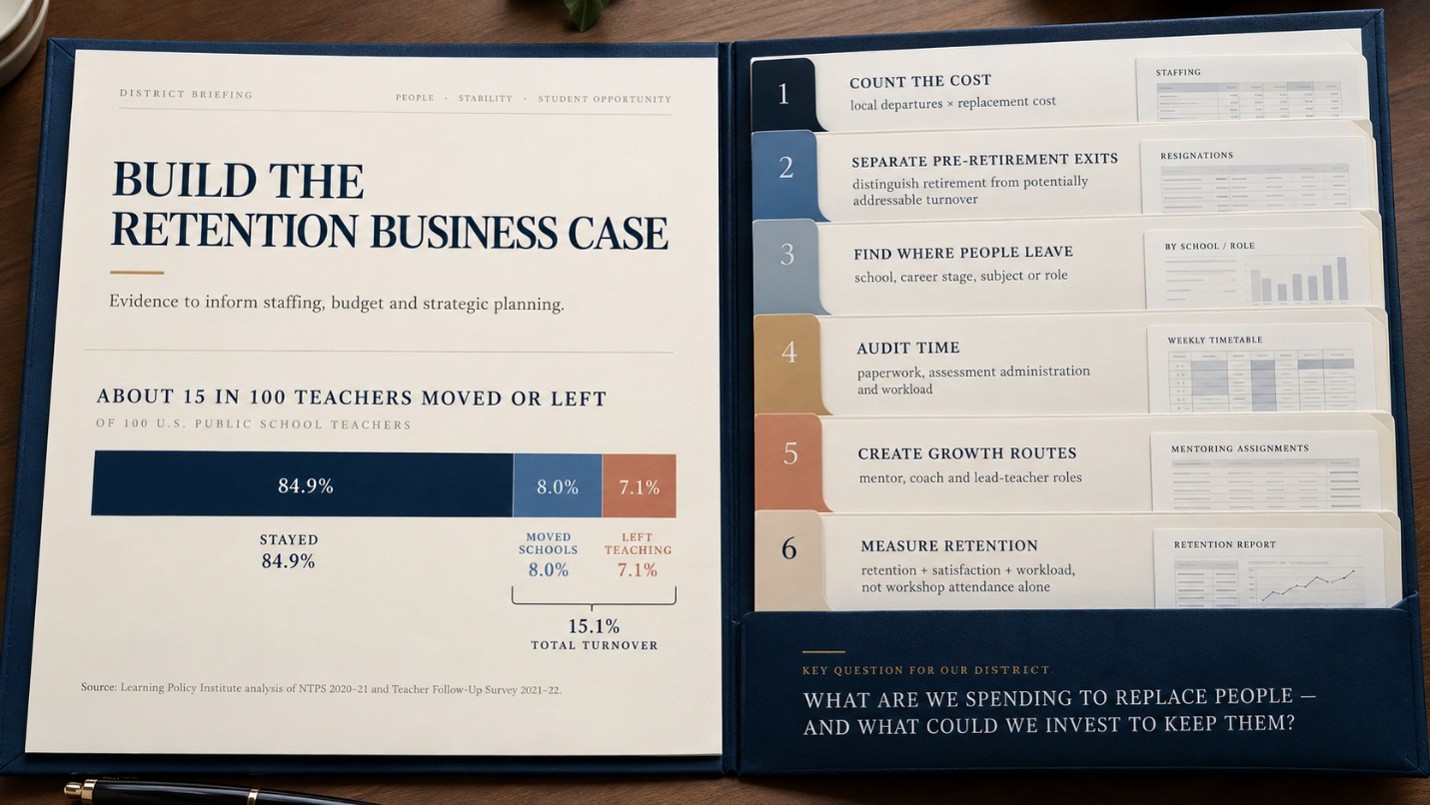
A strong case for the board does not need to be complicated. It needs to be honest and local.
- Count your own turnover cost. Use LPI’s per-teacher estimate as a starting point, then adjust using your own figures for substitutes, recruitment and onboarding.
- Separate voluntary, pre-retirement exits. These are the departures where growth and working conditions can make a difference.
- Find where people leave. Is it early-career teachers? A particular school? Special education? Turnover is rarely spread evenly.
- Audit time before buying anything. If teachers spend hours on paperwork and assessment admin, growth programs compete with that time. Streamlining assessment work without weakening judgement covers where that time can be recovered.
- Give strong teachers somewhere to go. Mentor, coach and lead-teacher roles keep expertise in classrooms. Leadership development programs explores this further.
- Measure retention, not attendance. Compare retention of teachers in coaching or mentoring programs with those who were not. Track satisfaction over time, not just workshop sign-ups.
Growth Needs Evidence Teachers Are Not Afraid Of
One finding deserves more attention than it usually gets. Test-related job insecurity was among the conditions linked to lower teacher satisfaction. learningpolicyinstitute
This matters because real teacher growth depends on evidence. A teacher cannot improve their reteaching of fractions without knowing which students missed which skill, and why. Yet if student assessment data mostly arrives as a judgement on the teacher, it will feel like a threat, not a tool.
If teachers mainly see assessment results when someone is evaluating them, why would they ever treat those results as a resource for their own growth?
Districts that want growth to drive retention need to separate the two uses of evidence. Leaders can still use data for accountability. But teachers also need low-stakes, specific evidence they can explore with a coach or colleague, without feeling exposed. Instructional coaching covers how coaching can use evidence this way.
The Choice Districts Are Really Making
The business case for teacher growth is not “spend more on PD.” It is a recognition that districts already spend on teacher development every year, much of it on replacing people instead of keeping them.
National evidence suggests that supportive leadership, real professional growth, manageable workloads and fair pay are all linked to teachers staying. None of these is free. But the cost of not acting is already in the budget. It is just harder to see.
FAQs
Q: How much does teacher turnover cost a US school district?
A: The Learning Policy Institute’s 2024 estimates are $11,860 per teacher in small districts, $16,450 in medium districts and $24,930 in large districts. These figures cover separation, recruitment, hiring and training. They do not include the cost of lost student learning.
Q: Does professional development improve teacher retention?
A: National data show that teachers who report leadership that promotes professional development and collaboration leave at about half the rate of teachers who do not (9.0% vs 18.7%). This is an association, not proof of cause. The type of development matters. Ongoing coaching and collaboration are more closely tied to retention than one-off training days.
Q: What percentage of US teachers leave each year?
A: Between 2020–21 and 2021–22, 15.1% of US public school teachers moved schools or left teaching. About 74% of those who left did so voluntarily for reasons other than retirement.
Q: Is teacher pay or teacher growth more important for retention?
A: Both matter. LPI found that each $1,000 salary increase was linked to a turnover drop of about 0.34 percentage points. Leadership, growth opportunities and job satisfaction were also linked to retention. A credible strategy addresses pay and working conditions together.
Q: How should a district measure whether teacher growth investment is working?
A: Track retention rates of teachers who take part in coaching, mentoring or career pathways against those who do not. Add teacher satisfaction and workload measures over several years. Counting workshop attendance alone will not show whether the investment is keeping teachers.