

Every fall, a familiar meeting happens in schools across the country. Last spring’s state results go up on the screen. Someone points to the lowest bar, often third-grade reading or seventh-grade math. Within twenty minutes, that bar has become the school improvement goal for the year.
It feels decisive. It is also one of the most common ways a school spends a year working hard on the wrong problem.
So here is the short answer. Using assessment evidence for school improvement means choosing a priority that passes four tests:
- It is real. It is not a quirk of who happened to test.
- It is significant. It affects many students, or it is getting worse.
- It is specific. You can name the skill, not just the subject.
- It is movable. Teachers can act on it, and you can see change before next spring.
The lowest score might pass all four tests. Often it doesn’t.
A Low Score Is the Start of a Question
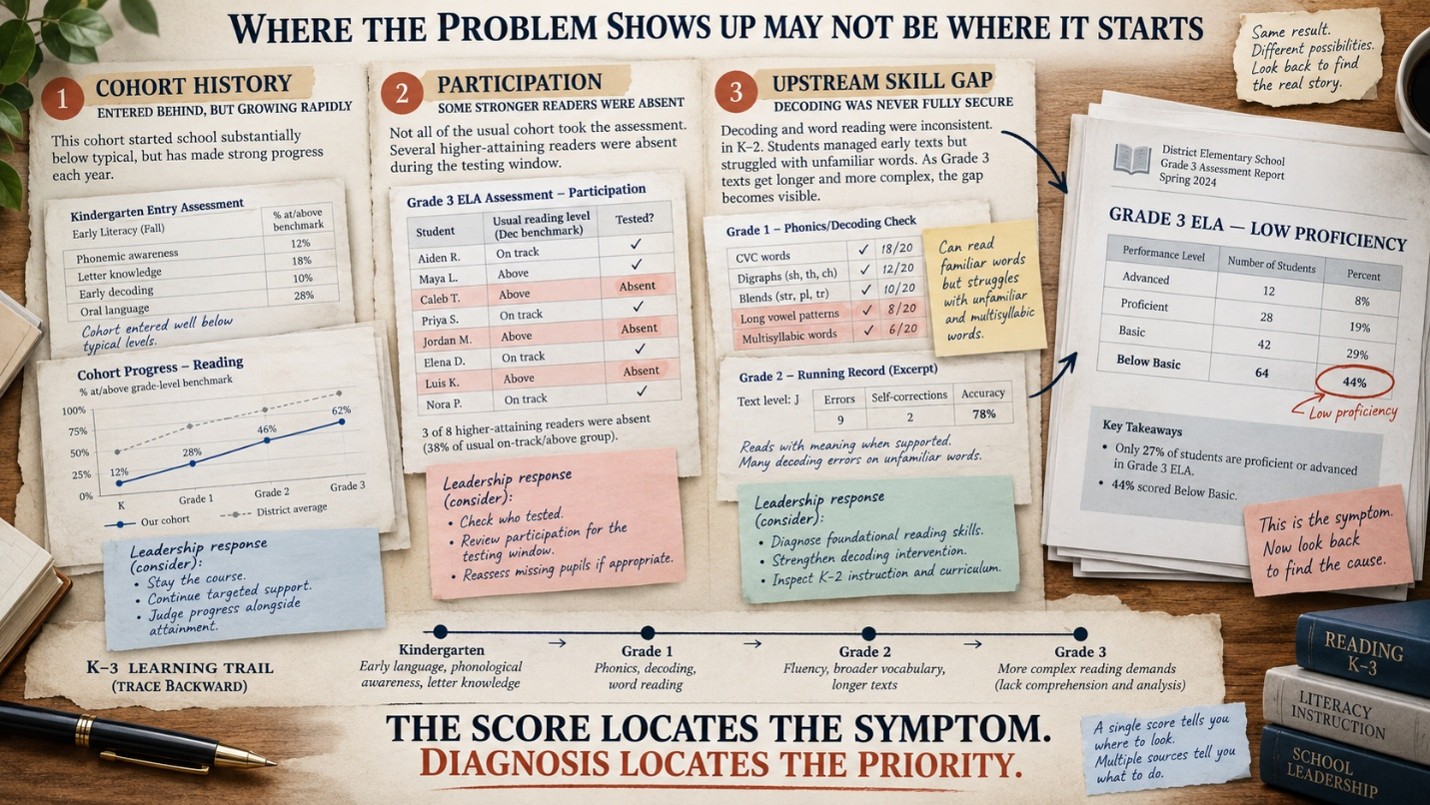
Take a hypothetical elementary school where grade 3 ELA proficiency is the lowest in the building. “Improve grade 3 reading” goes straight into the plan.
That number could mean several different things:
- This cohort may have entered kindergarten well below grade level and grown faster than any other grade since.
- A group of stronger readers may have missed the testing window.
- Decoding skills may never have been secure in grades K–2. In that case grade 3 is where the problem shows up, not where it starts.
Each explanation leads to a different priority, and only one of them points at grade 3 teaching.
That is why the first two checks are about growth and participation. A grade that scores low but is growing quickly needs protecting, not alarm. The difference between student growth vs attainment matters more at priority-setting time than almost anywhere else.
Before anyone interprets a proficiency rate, someone should also confirm who took the assessment. A school-wide percentage built on a partial cohort can send a leadership team in the wrong direction with full confidence.
What Principals Say They Actually Find Useful
Research here is more practical than the slogans about “data-driven schools.” A 2025 peer-reviewed study in Leadership and Policy in Schools by Elizabeth Zumpe (University of Oklahoma), Derrick Dzormeku (University of Massachusetts Lowell) and colleagues, published online in July 2025, looked at this question directly. The researchers interviewed principals in a district that was rolling out new data dashboards, to understand which data principals find useful and how their organizational context shapes their data use.
The findings are worth a careful read. The principals placed high value on diagnostic assessments, attendance and data on students’ experiences. They combined these sources to build a data culture, understand students as whole people and organize interventions. The barriers were data overload and accountability pressure that got in the way rather than helped. The authors call for wider data access and for accountability reforms that support principals’ data use instead of undermining it. tandfonline
The study has limits. It is an interview study in one US district. It describes how principals see and use data, and it does not measure whether those practices raised achievement. It should not be read as proof that any single type of data improves outcomes.
Still, two implications stand out for leadership teams.
Diagnostic evidence drives action. The data principals trust most for action sits close to the skill. A state proficiency rate tells you where to look, but it rarely tells you what to do on Monday.
More dashboards do not mean better priorities. If overload is a real barrier, then choosing a priority is partly a decision about which data the team will set aside for a while.
Four Tests Before Anything Becomes a Priority
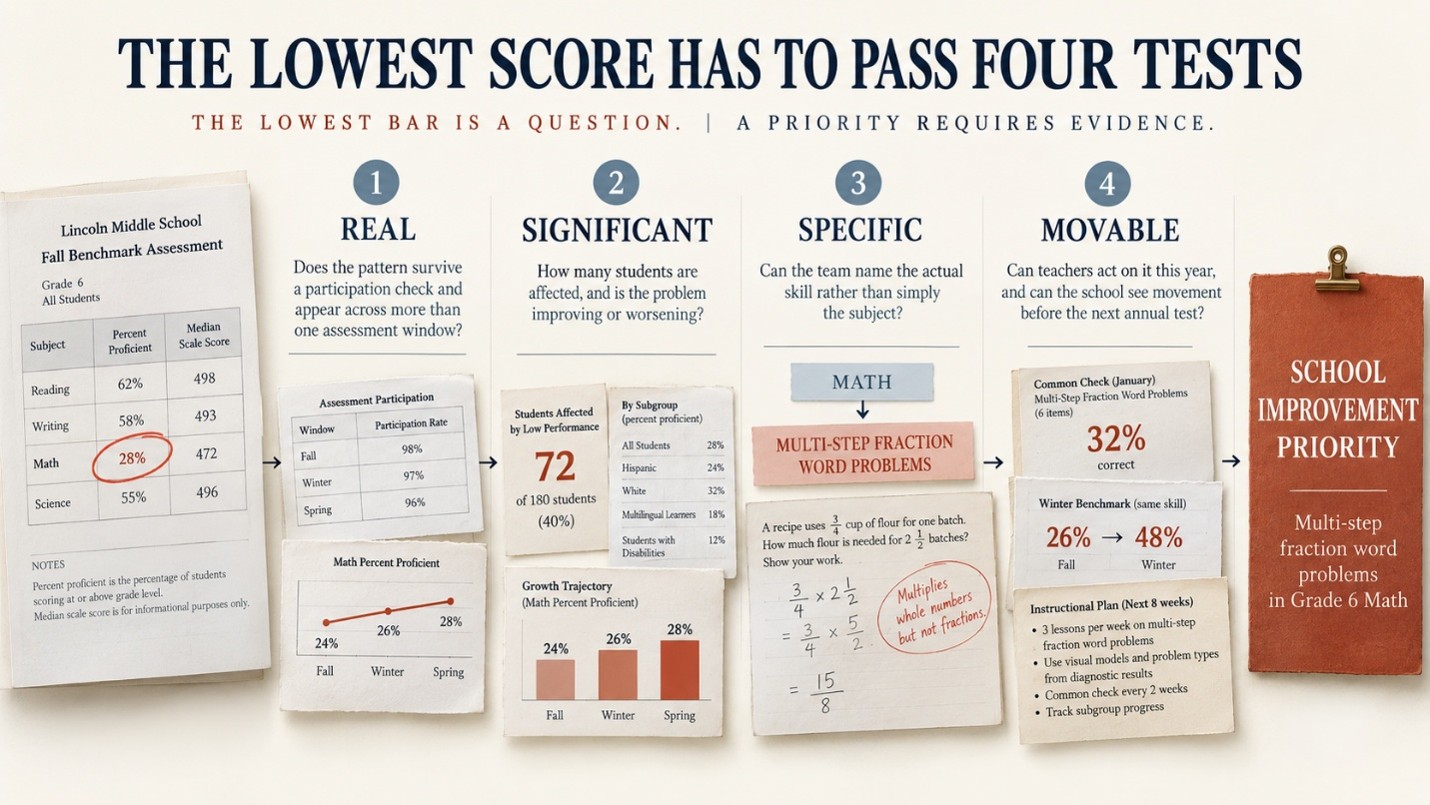
| Test | Question to ask | Evidence to check | Warning sign |
| Is it real? | Does the pattern hold beyond one test day and one group of test-takers? | Participation by grade and student group; the same pattern across fall, winter and spring benchmarks | The result rests on one assessment window or a partial cohort |
| Is it significant? | How many students does it affect, and is it improving or getting worse? | Number of students below benchmark; growth from fall to spring | A low level with strong growth gets treated as a crisis |
| Is it specific? | Can we name the skill or standard, not just the subject? | Standard- or competency-level results; item patterns; diagnostic assessment | The priority reads “improve math” |
| Is it movable? | Can teachers act on it this year, and will we see change before the state test? | An interim or benchmark measure of that skill; staff time available | The only success measure is next year’s state score |
Most priorities fail at the third test. “Math” is not a priority. “Setting up multi-step word problems” might be. Getting there takes learning gaps analysis that moves from the subject score down to the skill.
Class comparisons help at this stage too. If every class in a grade shows the same weakness, the cause is probably upstream: curriculum sequence, pacing or the assessment itself. If one class looks very different, the cause is more local. That is often good news, because something may be working in the room next door.
If your improvement goal can only be judged by next year’s state test, how will you know in January whether it is working?
Writing a Priority Teachers Can Act On
Here is a hypothetical contrast.
Weak: “Improve math achievement in grades 3–5.”
Stronger: “Raise grade 4–5 accuracy on multi-step fraction word problems. Winter benchmark results suggest most students can compute with fractions but struggle to set up the problem. We will check progress with two short common checks and the spring benchmark.”
The stronger version names the grades, the skill, the likely cause and the evidence that will show progress. It also points to a teaching response: work on problem setup, not more computation drills.
This is the point where evidence turns into building a school improvement plan with owners, time and checkpoints.
One Priority Means Letting Some Data Wait
The hardest part is often political rather than analytical. Every weak number has someone who cares about it.
Choosing one or two priorities means saying out loud that other issues will be monitored this year, not fixed. That is not neglect. A school has limited time, and focus is the only way that time produces change anyone can see.
If your school has seven improvement priorities, does it really have any?
Start With the Question, Finish With the Review
The lowest score tells a leadership team where to start asking questions. It does not tell them what to fix. A real priority is where several pieces of evidence point the same way, at a level specific enough to teach, and with a way to check progress inside the school year.
Then comes the step many schools skip: going back and asking whether the priority actually moved.
FAQs
Q: What is the best way to choose a school improvement priority using assessment data?
A: Start with the lowest results, then test them. Check participation, compare growth with attainment, drill down to the specific skill, and confirm that you can measure change within the year. Choose the issue that passes all four checks, not simply the lowest number.
Q: Should schools base improvement priorities only on state test results?
A: No. State results are useful for spotting where to look, but they arrive once a year and rarely show the specific skill gap. Benchmark and diagnostic assessments give leaders evidence they can act on and re-check during the year.
Q: How many school improvement priorities should a school have?
A: Few enough that every teacher can name them. In practice, that usually means one or two. Other issues can still be monitored without being formal priorities.
Q: What is the difference between growth and attainment when setting priorities?
A: Attainment shows where students are now. Growth shows how much they have moved. A low-attaining grade with strong growth may need support to continue, while a higher-attaining grade with flat growth may need more attention than its score suggests.
Q: Why does assessment participation matter for school improvement decisions?
A: If some students did not take the assessment, the result may not represent the whole grade or school. Leaders should check participation by grade and student group before interpreting any percentage.
Q: How do you know if a school improvement priority is working?
A: Set an interim measure of the target skill before the work begins, such as a winter benchmark or short common checks. Then compare results across cycles instead of waiting for next year’s state test.