

Picture a Head of Mathematics opening the end-of-unit gap report for Grade 7. Twenty-three skills are flagged. There are three weeks before the next unit starts, and each teacher can spare about two lessons a week for catch-up. By the end of the department meeting, the plan says: “Revise all flagged areas.”
The scenario is hypothetical, but most assessment leads will recognize it. Everyone in that meeting did the right thing, and still nobody left with something they could teach on Monday.
This article is about that second gap. It is the distance between the report and the classroom, not the learning gap the report describes. Good intervention planning using assessment data depends less on reading the data well and more on making the choices the data cannot make for you.
A Gap Report Lists Problems. A Plan Makes Choices.
A learning gap report answers one question: where are students weak? A plan has to answer several more. Which gaps come first? For which students? In what form, taught by whom, by when? And how will we know it worked?
The report is complete by design. The plan has to leave things out by design, because teaching time is limited. When a plan tries to cover everything, it usually turns into revision of everything. Students re-cover content they already knew, and the hardest gaps get one rushed lesson.
So the first job of anyone planning intervention is subtraction.
The Step Between Data and Teaching Is Where Value Is Won or Lost
A peer-reviewed study by Hebbecker, Förster, Forthmann and Souvignier looked closely at this middle step. The researchers followed 120 teachers and their 2,458 students over time. They compared how actively teachers analysed progress data (taken from system log files), how often teachers said they made instructional decisions, and how much students progressed in reading. researchgate
Teachers who analysed the data more were more likely to make instructional decisions, and their students made more progress. Teacher support was linked to more data analysis and, through that analysis, to better learning progress. However, the self-reported frequency of instructional decision-making was not linked to students’ learning progress.
The study does not prove cause and effect. It used one reading-assessment system, and “frequency of decisions” was self-reported. Even so, it points to something leaders should take seriously. Making more changes to teaching was not what predicted progress. One reasonable reading is that the quality and fit of a decision matter more than how often a decision is made.
For a school, this means a count of intervention sessions (“we ran 40 catch-up lessons”) is not evidence of anything. The better question is whether each session targeted a named skill for a known reason.
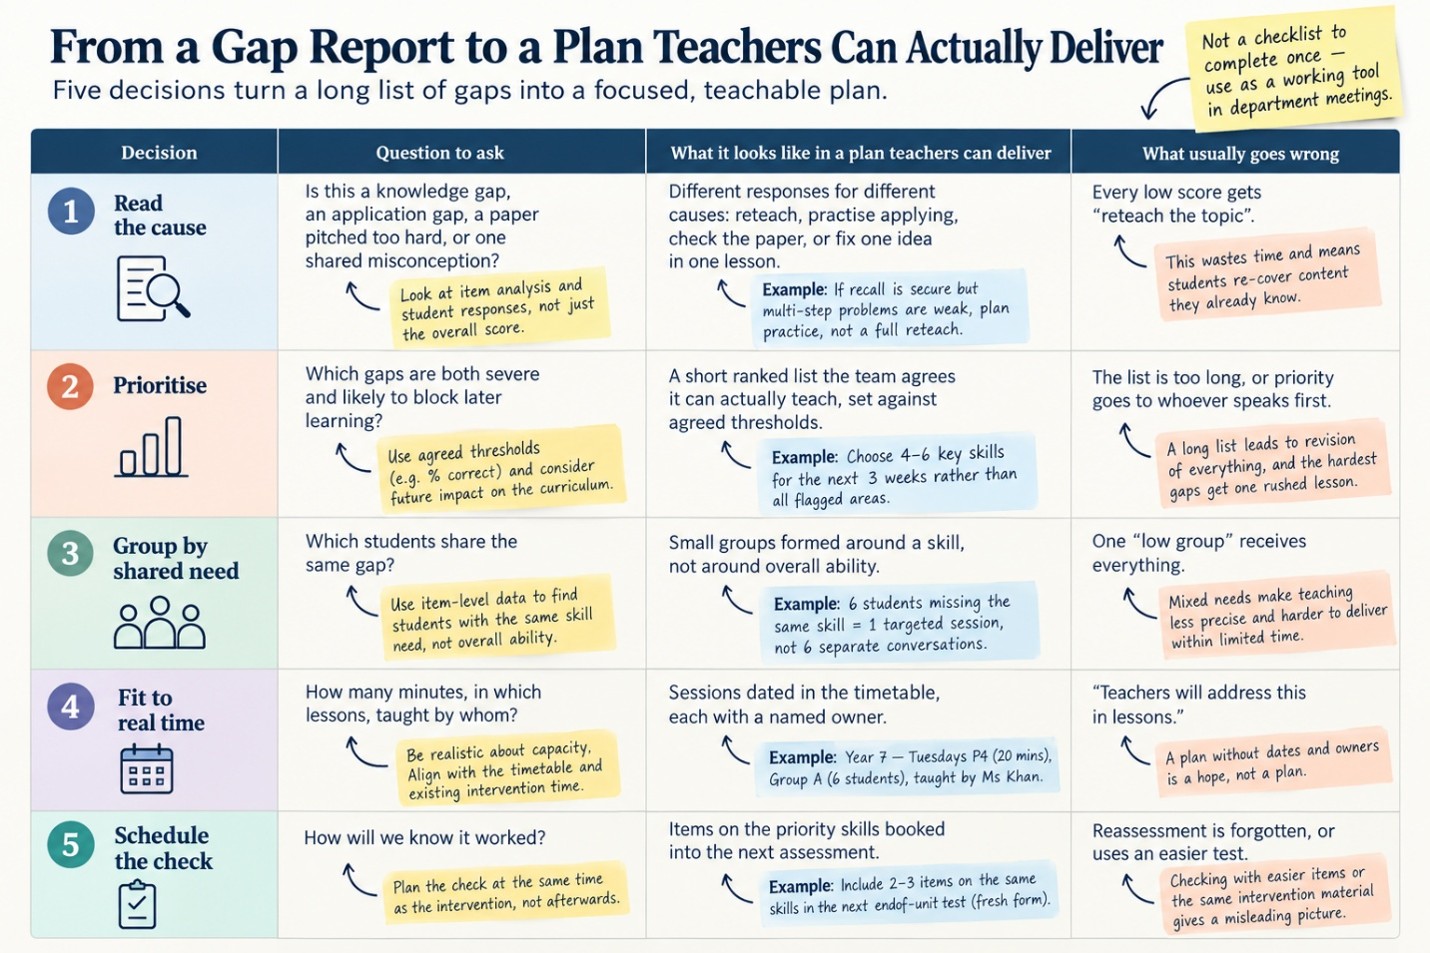
The first decision changes everything after it. A class that fails a topic because students never learned the content needs reteaching. A class that handles recall well but falls apart on multi-step problems needs practice in applying the content, and teaching the content again wastes weeks. If you are unsure which is which, start with finding the skill behind a weak assessment result before writing any plan.
The second and third decisions are where most of the time saving happens. Six students missing the same skill can be one session, not six separate conversations. Deciding between reteaching vs consolidation for each skill also frees time that would otherwise go to content students have already secured.
The fourth decision is the one plans most often skip. A reteaching plan without dates and owners is a hope, not a plan. If capacity is the real constraint, closing learning gaps without overloading teachers looks at how to scale support without breaking the timetable.
Why Good Plans Lose Strength Between the Meeting Room and the Classroom
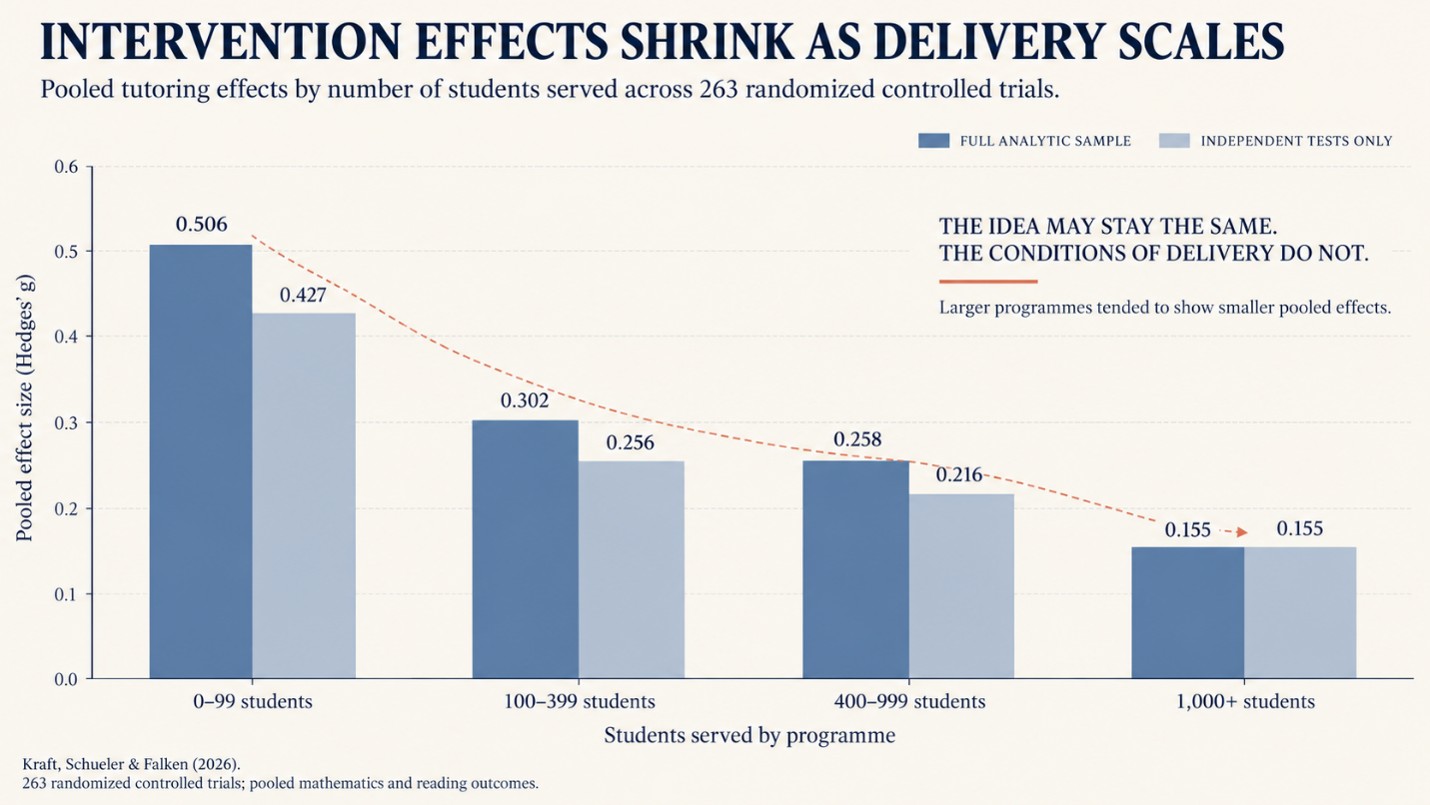
There is a second reason to design for the conditions you actually have. A recent meta-analysis by Kraft, Schueler and Falken examined tutoring, the most studied form of academic intervention. Across 263 randomized controlled trials, they found a large average effect of 0.40 standard deviations, driven mainly by literacy tutoring in elementary grades. When they narrowed the sample to larger programs measured with independent standardized tests, the estimates fell by 45% to 60%. Programs serving fewer than 100 students averaged 0.51 SD, while those serving 100 to 399 students averaged 0.30 SD. They also found that tests designed by the intervention’s own developers produced effects more than twice as large as independent tests (0.72 SD versus 0.33 SD). doi
Some care is needed here. These are mostly US tutoring programs, many in early reading. They are not the same as a school’s internal reteaching groups. But the pattern is a useful warning. The same good idea, delivered with less time and larger groups, tends to deliver less. A plan written for ideal conditions will be delivered in real ones.
Two questions follow for any school:
If an intervention plan only works when every teacher has spare time, is it a plan or a wish?
If the only evidence that a gap has closed comes from the same worksheet used to teach it, what have we actually measured?
The second question matters for how you reassess. Checking the priority skills in a fresh form, in the next scheduled assessment, gives a more honest answer than a quiz built from the intervention material. Retake and reassessment policy explores what that check should prove.
What Leaders Should Check Before Signing Off a Plan
A plan does not need to be long to be strong. Before approving one, leaders can ask:
- Can each teacher name the skill, the students and the date for every session?
- Is any skill on the list because it is easy to teach rather than important to fix?
- What was deliberately left out, and is that written down so it is not forgotten?
- Does the plan match the time the timetable really has, not the time we wish it had?
- Is the reassessment already booked, and does it test the skill in a new form?
- Across a school group, are campuses using the same severity thresholds, so one school’s “critical” means the same as another’s?
The last question is easy to overlook. If every campus sets its own priorities by feel, the group cannot compare where intervention is working.
A Smaller Plan That Gets Taught Beats a Complete One That Does Not
A learning-gap report is information. It becomes instruction only when someone decides what to teach, to whom and when, and then checks whether it worked. The evidence suggests that the quality of those decisions, and the realism of the conditions they are delivered in, count for more than how many there are.
So the test of a good plan is simple: could a teacher pick it up on Monday morning and teach from it? If not, the planning is not finished yet. For the full picture of where this step sits, see the assessment-to-intervention cycle.
FAQs
Q: What is intervention planning using assessment data?
A: It is the process of turning assessment results into specific teaching actions. It covers which skills to target, which students need support, how they are grouped, when sessions happen, who teaches them, and how progress will be checked afterwards.
Q: How is a learning gap report different from an intervention plan?
A: A learning gap report shows where students are weak. An intervention plan decides what to do about it within real time limits. The report is complete; the plan is selective, dated and assigned to named people.
Q: How many learning gaps should a teacher target at once?
A: Research does not give one correct number. A practical rule is to choose a short list the team can genuinely teach in the time available, ranked by severity and by how much each gap blocks later learning. Write down what was left out so it can be revisited.
Q: Should every low score lead to reteaching?
A: No. Reteaching suits knowledge gaps, where students never learned the content. Application gaps need practice in using the content. A paper pitched too hard needs a review of the assessment, and a shared misconception may need only one focused lesson.
Q: How do you know if an intervention worked?
A: Schedule a reassessment of the priority skills in the next assessment cycle, ideally in a fresh form rather than the same worksheet used during intervention. Compare results against the earlier baseline.
Q: How can school groups keep intervention planning consistent across campuses?
A: Agree on shared severity thresholds, shared skill definitions and a common reassessment schedule. This lets leaders compare where intervention is working without each campus setting priorities by feel.