

Picture a seventh-grade math team in a middle school. It is late October, and the fall benchmark report is on the screen. The pattern looks clear: students are weak on proportional reasoning. Someone says, “We need to reteach ratios.” Everyone agrees, and the meeting ends on time.
In December, the team meets again with the winter results, and ratios still look shaky. Was the reteaching too short? Did it reach the wrong students? Was the problem ever ratios, or was it the word problems built around them? Nobody can say. The October decision was never written in a way that the December data could answer.
Most teachers can read an assessment report. Far fewer have been helped with the next step: turning what they read into a teaching decision that later evidence can confirm or contradict.
Short answer: Assessment data literacy for teachers is the ability to read an assessment report, judge what it can and cannot show, and turn it into a specific teaching decision. The most useful decisions are testable. Each one names the skill, the students, the change, the evidence expected, and the date it will be checked.
Reading the Report Is the Easier Half
In many districts, data literacy training stops at interpretation. Teachers learn what a scale score means, how proficiency bands work, and which standard came out lowest. All of that is necessary, but it leaves teachers exactly where the hard thinking begins.
A report describes the past. A teaching decision is a bet about the future:
If we change this, for these students, we expect that result by this point.
When the bet stays vague (“reteach,” “more practice,” “small groups”), there is nothing to check later. The team cannot learn from the outcome, because it never wrote down what it expected.
This suggests a fuller definition of data literacy. It includes a second skill that rarely gets named: writing a decision that could turn out to be wrong.
What One Study Suggests About Insight Versus Action
A 2024 report from SRI International offers a small but useful window into this gap. The research was funded by a U.S. Department of Education grant, and it developed and tested survey tools for measuring how school teams use data, as part of a planned study of the Data Wise improvement framework. The teacher survey was piloted in spring 2021 with 15 grade 5 teachers, three of whom had Data Wise experience.
The overall pilot responses show a pattern worth noticing. Most teachers said they understood what the data in their meetings measured. Far fewer said the meetings changed what they did in class.
The limits here matter. The authors note that the pilot had a small sample and focused on specific use cases, and they say larger, more diverse samples are needed before the findings can be generalized. The study was built to test survey questions. It was not built to describe American teachers in general, so the numbers should not be quoted as national figures.
What the pattern does offer is a reasonable hypothesis: understanding data and changing instruction are separate steps, and the follow-up loop is where teams tend to lose momentum. The survey itself lists “measuring whether a new instructional practice improved student learning” as its own data-use skill, separate from gauging student understanding or refining instruction. That separate skill is the subject of this article. sri
What Makes a Teaching Decision Testable
A testable decision has five parts: the skill, the students, the change, the expected evidence, and the check date. It does not have to be complicated. It just has to be written down before the teaching starts.
| What the report showed | Typical untestable response | Testable teaching decision |
| Grade 7 math: low accuracy on ratio word problems, solid on computation | “Reteach ratios.” | “For the 9 students below 50% on ratio word problems, teach a tape-diagram routine in three 20-minute sessions. We expect at least 7 of the 9 to solve 3 of 4 similar problems on an exit ticket by November 14.” |
| Grade 4 ELA: most students picked the same wrong answer on one inference item | “More inference practice.” | “Address that one misconception in a single whole-class lesson. Recheck on Friday with two new inference items. If more than 75% answer both correctly, move on.” |
| Grade 9 science: strong recall, weak on questions that ask students to interpret data | “Review the unit.” | “Keep the content as it is. Add two graph-reading tasks per week for three weeks, then compare accuracy on graph items in the next unit test with this one.” |
| One class well below the grade-level average | “That teacher needs support.” | “First check who took the test and the item-level results. If the gap holds on the same skills, co-plan two lessons with a colleague and compare results on the next common assessment.” |
All figures in the table are hypothetical illustrations. Teams should set their own thresholds.
Why Good Teams Still Make Untestable Decisions
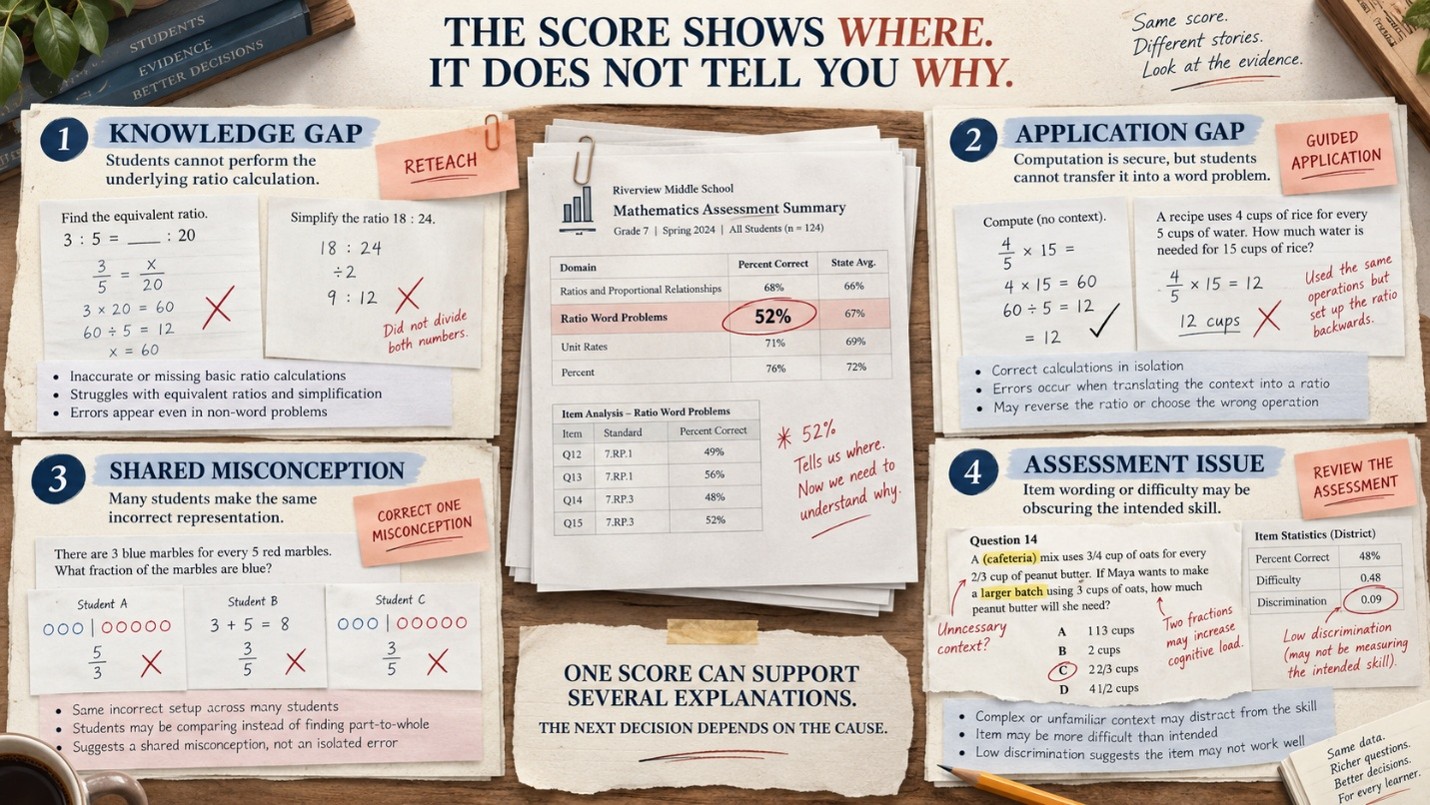
The report shows a score, not a cause. If a report only says “Ratios: 52%,” a team cannot tell whether students never learned the content, know it but cannot apply it, or share a single misconception. Vague evidence invites vague decisions. Reports should break results down to the skill level and point toward a likely cause, which is what competency reports useful for the next teaching step are meant to do.
“Reteach” becomes the default answer. Some skills need full reteaching, some need practice, and some are already secure. When every weak result triggers reteaching, time gets spread thin, and nobody can see what any single change achieved. Deciding whether to reteach or consolidate is often the most useful decision a team makes all month.
Nobody owns the follow-up. The next meeting usually starts with new data, not with last month’s decision. That is why professional learning communities work best when every meeting opens with a review of the last one.
More support with data does not automatically mean more change in the classroom. In a U.S. Institute of Education Sciences evaluation involving 102 elementary schools across 12 districts, teachers receiving additional support for data-driven instruction were more likely to report regular coaching on analyzing and interpreting student data. Yet the differences were much smaller when researchers looked at collaborative activities such as analyzing student needs or modifying lesson plans in response to data. The study did not find an overall increase in teachers’ data use or instructional practices. The implication is not that coaching is unhelpful, but that access to data and support for interpreting it are only part of the process. Teams also need a routine that turns an interpretation into a specific instructional change and then returns to the evidence to see whether that change worked.
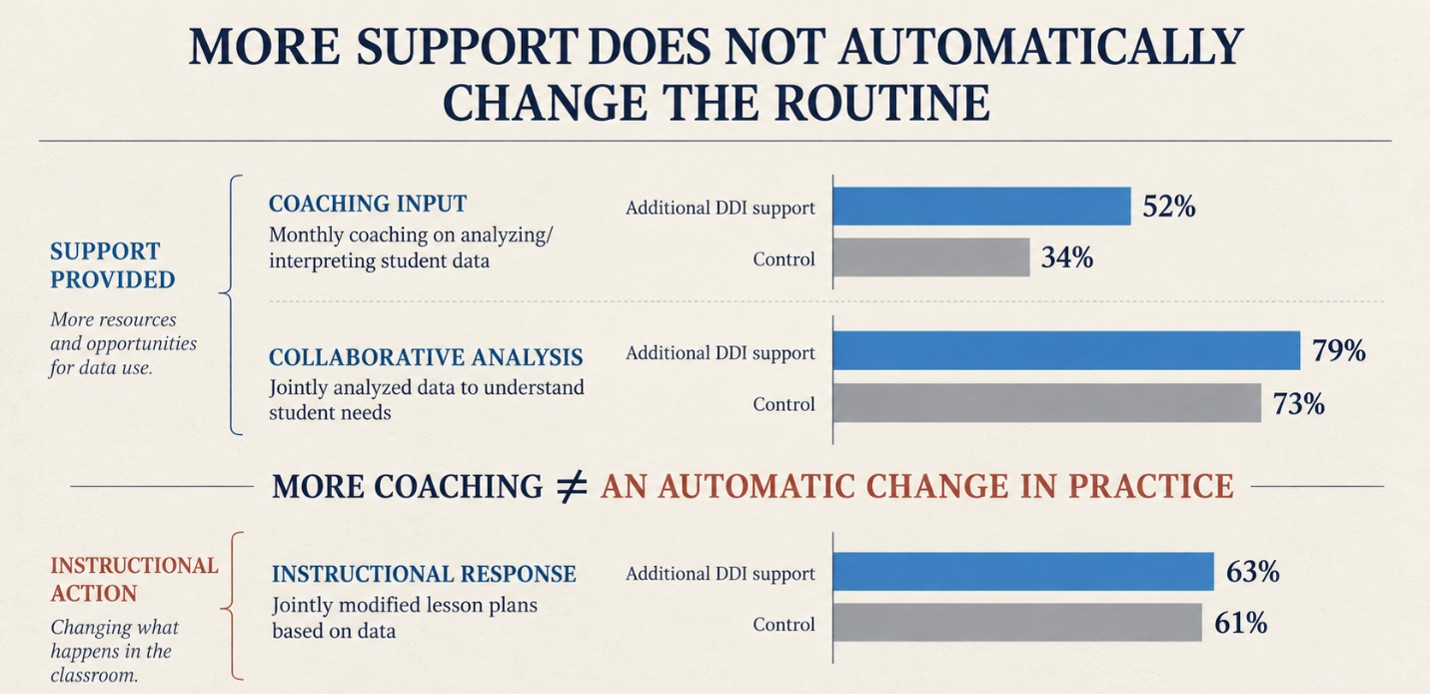
Source: IES Evaluation of Support for Using Student Data to Inform Teachers’ Instruction
What Principals and District Leaders Can Do
The conditions that produce testable decisions are mostly set by leaders, not by individual teachers.
- Ask one question in every data meeting: “If this works, what will we see, and when?”
- Keep a simple decision log with one line per decision: skill, students, change, expected evidence, check date, and result.
- Open each meeting with last meeting’s log, before anyone looks at new data.
- Make sure the next assessment actually includes items on the targeted skill. If it does not, the decision cannot be tested.
- Treat “it didn’t work” as a useful finding. If teachers expect to be judged on every outcome, they will write vague decisions that can never fail.
This is how assessment data driving instructional decisions becomes a working routine rather than a slogan.
Two questions are worth asking your own team:
If a teaching change could never be shown to have failed, how would anyone know it worked?
How many of last semester’s data meetings ended with a decision that someone actually went back and checked?
Data Literacy Is Measured by What Happens Next
Teachers’ data literacy is often judged by how well they read a chart. A more useful test is whether the decisions they make from that chart can be checked, and whether anyone checks them. When teams write down a prediction and a date, every assessment becomes evidence about both student learning and the teaching that responded to it.
FAQs
Q: What is assessment data literacy for teachers?
A: It is the ability to read an assessment report, understand what it can and cannot show, and turn the findings into a specific teaching decision. Strong data literacy also includes checking afterward whether that decision improved learning.
Q: What is a testable teaching decision?
A: It is a decision written clearly enough that later evidence can confirm or contradict it. It names the skill, the students, the teaching change, the result expected, and the date it will be checked.
Q: How is this different from data-driven instruction?
A: Data-driven instruction often stops once data has informed a plan. A testable decision adds a prediction and a follow-up check, so the team learns whether the plan worked instead of simply assuming it did.
Q: How can school leaders build teacher data literacy without adding workload?
A: Keep it light. Use a one-line decision log, start each data meeting by reviewing the last decision, and make sure the next assessment includes the targeted skill. These habits replace vague discussion rather than adding new paperwork.
Q: How soon should a teaching decision be checked?
A: Soon enough to adjust course, usually within two to six weeks. Short checks such as exit tickets or a few targeted items often work better than waiting for the next benchmark.
Q: Does research show that teacher data use improves student achievement?
A: The SRI pilot discussed here was not designed to measure student outcomes; it tested survey questions with 15 teachers. Leaders should be careful with broad claims. What matters is what teachers change and whether they check the result.